IPCC SR 1.5 - Table 2.2 & Budget Integrals per Unit Time
- Greta Thunberg
- Greta Key messages
- Table 2.2
- Additional Warming Estimates
- Budget Integrals
- Budget Integrals per unit time
- the Feedback Issue - including the bath-tap-plug analogy
- Acceleration; Early-Onset Runaway-Rates of Climate-Change
- We were lied to
- Adair Turner & the UK Climate Act
- Alliance for UNFCCC-Compliance
- International Support
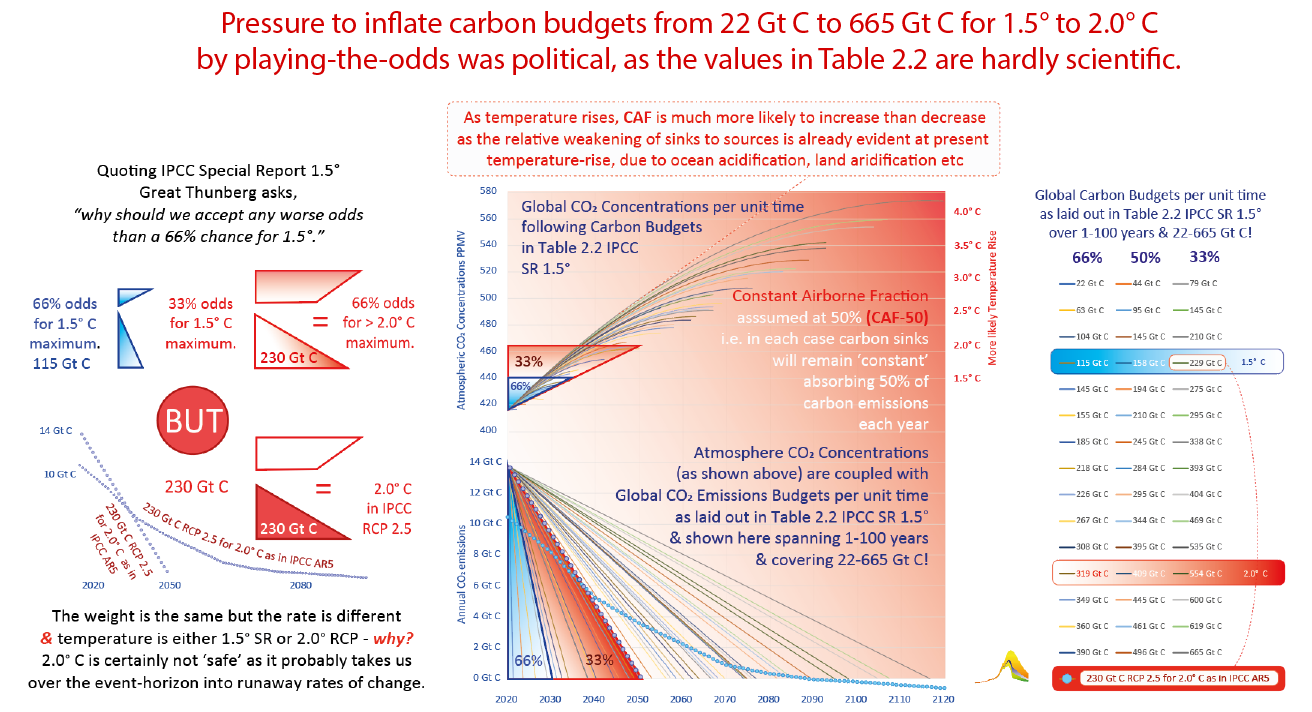
Noting that the overall weight of the budget over time (the path-integral) is the primary determinant of the atmospheric CO2 concentration rise,
here is another way of looking at the Global Carbon Budget (GCB) weight-totals in GtC in Table 2.2 in groups of three (66% 50% 33% odds).
- As each of the various weights of the carbon budgets is used-up, the actual linear rate is shown to the year each GCB reaches zero
- Pathways of atmospheric CO2 concentrations for each of the GCBs are shown too (simply assuming a Constant Airborne Fraction (CAF) of 50%)
- knowing that the Airborne Fraction of emissions is more likely to increase than decrease as temperature rises, due to land aridification and ocean acidification
- which in turn means that temperature rises in Table 2.2 are more under-estimates (continuing a pattern in IPCC over recent years).

BUT . . . why do RCP 2.6 & SR 1.5 contradict each other . . . ?
The discrepancy between RCP 2.5 & Table 2.2 in IPCC's Special Report on 1.5° C is disturbing. In this context it suggests that
as climate-science 'evolves', the situation is becoming less rather than more serious, which is contrary to the evidence (& common sense).
The total budget weight in RCP 2.5 for 2.0° C is 230 Gt C. In Table 2.2 in IPCC SR 1.5 230 Gt C (229 Gt C) with 33% odds for 1.5° C.
Any pressure to increase carbon-budget-size/lower-the-temperature is more likely to have come from the politics than from the science.
This increase with odds, puts numbers arbitrarily into a hat, where playing the 'odds' is more of a smokescreen to conceal rather than reveal that.
The danger we face is acceleration and the potentially lethal extent of the feedback-unknowns (both known & unknown) that will result from that.
