+/- 17 years to cross the 2.0° C threshold, where delay sees rising risks
 Click logo to return to 'links-page'
Contraction with immediate Convergence - structured rates 2030-2050
The rising global average of atmospheric CO2 concentration, is the result of an accumulation of rising CO2 emissions.
Rising global temperature is still primarily a response to rising atmospheric CO2 concentrations.
However, this is changing.
Since 1992, the objective of the UNFCCC has been to stop the rise of atmospheric CO2 concentration.
This means, "on the basis of precaution and equity" bringing CO2 emissions down to (net) zero globally.
Consequently, rational-C&C-rates-based-analysis was never more essential than now as we
continue the emissions that cause this problem much faster than we respond to avoid it.
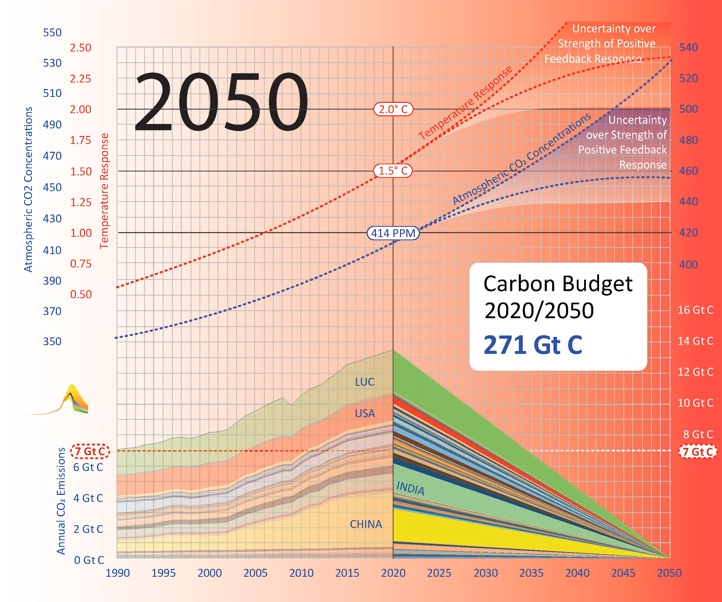
CLICK on the image below for the movie of where we are & where we're headed . . .
Doing this will animate the chart revealing the
[a]
close correlationship between CO2 emissions & CO2 concentrations
[b] acute time-dependency between these & temperature rise
[c] 1.5° C limit to temperature rise has already been breached
[d] 2.0° C
limit will also be breached, unless CO2 emissions are zeroed globally before ~2037
[e] revealing increased influence of feedback-effects force-majeure.

Here is an update on this movie
2020-2100 this includes growth as usual minus rising climate damages.

Sharing
The international sharing issues - guesswork/framework - are addressed here & here.
All countries in the chart/movie above are listed in the graphic below. Complete detailed history here.
Time wasted
A lot of valuable time has been completely wasted over the last 25 years when total annual CO2 output was around 7Gt C/year.
As it is now ~14 Gt C & temperature looks likely to be taken over the 2° C threshold, the situation is now obviously urgent.
We obviously have to draw a line somewhere and sometime ago 2° C was accepted as that threshold.
In plain talk, this animation shows clearly - with rates/numbers not with rhetoric/adjectives - how we are likely to complete
the journey
from the climate-emergency we've been in, to
climate-crisis that will largely overwhelm complex life on the planet.
It is seen by some as necessary to chide governments for their undoubtedly inadequate response to the climate problem.
However, it more useful to help governments organize internationally for an adequate & coherent solution to UNFCCC-Compliance.
This means net-zero soon enough to avoid uncontrollable runaway rates of global climate change
from
developing,
as the danger
of this happening accelerates in proportion to any further delay in zeroing CO2 emissions globally.
It also means that the faster the
global contraction rate is, inevitably the faster the convergence rate
will have to be.
It also means that per-capita equality at zero is inevitable. For clarity that is assumed as equal from 2020 in the animation.
CLICK on the image below
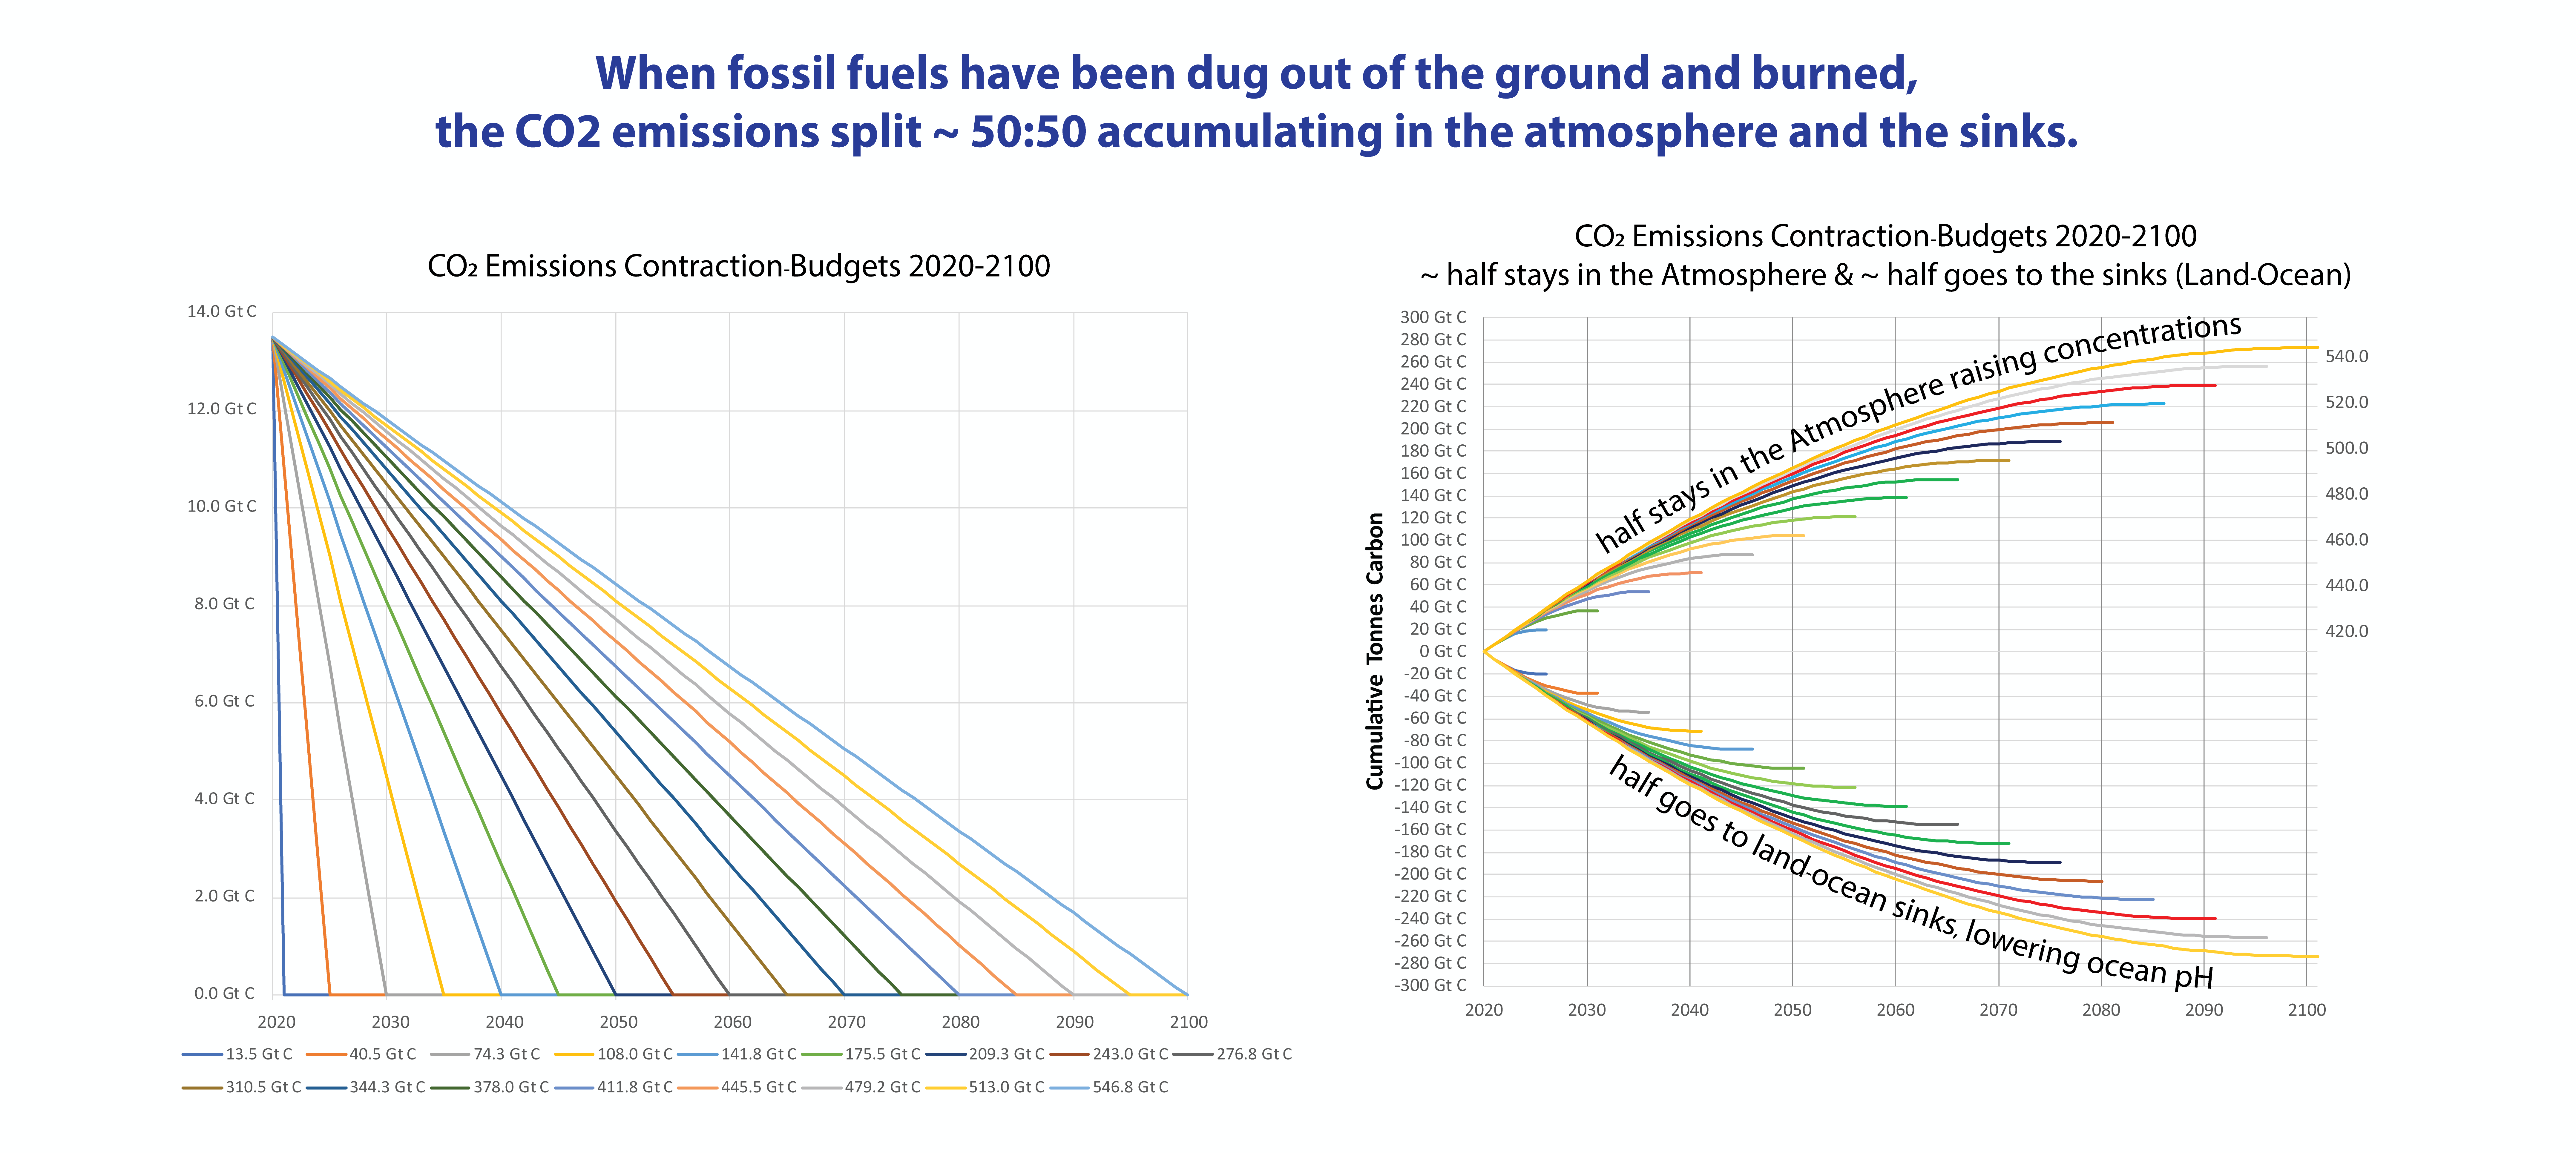
Doing this will animate the chart so the simple but deadly arithmetic of atmospheric CO2 accumulation is revealed.
NB one part per million by volume (PPMV) of atmopsheric CO2
concentration weighs 2.13 Gt C (Gigatonnes Carbon).
This is an easy conversion showing the unit measure of CO2 emissions and atmospheric CO2 concentrations.
By 2020 CO2 concentrations had risen to 414 PPMV. In other words in 2020 the atmosphere held 881.82 Gt C.
(In 1750, when fossil fuel burning began with the Industrial Revolution, PPMV were 280
i.e. 596.40 Gt C).
Prior to 2020, the curves for PPMV and temperature reproduce and also average actual data as stated.
From 2020 onwards the settings are: -
[a]
The Airborne Fraction (AF) of CO2 Emissions starting at 44% of emissions, with 56% returning to sinks;
[b]
With a projected decrease in 'sink-efficiency' of 0.16% per year - i.e. with a slow progressive increase in AF.
[c] The temperature increase from 'Climate-Sensitivity' [CS] is set at 4° C for CO2 doubling;
[d] With the 'pink-envelope' on-screen for CS covering; an 'uncertainty' of 3° to 5° C around 4° for CO2 doubling.

Reassessment of 'climate-sensitivity'
This startling revision of under-estimates in future climate projections shown here is part of a reassessment.
It has been obvious for over a decade that CO2-based-climate-sensitivity
is not constant over time-past/future.
The criticism within the modelling community has been that if a higher climate sensitivity value is used to project
higher temperature
values per-unit-ghg-concentration in future, it results in less accurate agreement between
temperature values per-unit-ghg-concentration in the past (and vice versa).
Non-CO2 factors
1. Rising future
temperature values are a response to more than just rising ghg CO2-e concentration.
For example the loss of sea-ice in the Arctic amounts not just to the loss of albedo (reflectivity) but also to
incurring the negative-albedo
of dark-blue-ocean; i.e. temperature increase is not directly CO2 correlated.
2. The huge extent to which incoming heat has been cumulatively trapped in the oceans where it is temporarily
'masked' through recirculated at deeper ocean levels but then also reaching and melting shelf-ice from underneath
causing glaciers to move and break-off
more rapidly from the perimeter, as in the Antarctic. Again temperature
increase is not directly CO2 correlated.
3. The 'blacking' of ice due to the increase of dirty-particulate deposition
reducing the reflectivity of the ice,
as in Greenland for example.
Once again, the resulting temperature
increase is not directly CO2 correlated.
4. When cloud cover is higher and
[a] 'white' it will provide more albedo (heat reflectivity). When it is lower and
[b] 'darker' it provides
'negative albedo' (heat absorption). Consequently the formation of clouds in this is critical.
A simplification of this vexed subject means more moisture in the atmosphere occurs with increased temperature
which in turn
increases the likelihood of darker cloud cover occurring.
CO2 factors
1. Land sinks, particularly forests under equilibrium temperature conditions, take up (sequester) around 25%
of the total of CO2 'source' emissions sent to the atmosphere. In other words they act as CO2 'sinks'. However,
as temperature rises many forests have been drying and becoming more easily combustible. When they catch
fire, they change from being sinks for CO2 to becoming sources
of CO2 adding emissions to the atmopshere.
2. Ocean sinks, under equilibrium temperature conditions, take up (sequester) around 25% of the total of CO2
'source' emissions sent to the atmosphere. In other words they too act as CO2 'sinks' to that extent. The standard
view from UKMO for example, was that as the 100% of source emissions increased, the increased 25%
going to
the ocean sinks would be removed by the hard-shell formation of CO2 sequestering plankton. As the plankton died
it would be removed
by the ever more active 'biological pump'. However, the increased ocean acidity being caused
by the increased CO2 deposition is decreasing the property of hard-shell formation. This means the biological pump
is less vigorous over time and the relative 'sink-efficiency' of the ocean
is decreasing. This means the airborne
fraction of emissions is increasing over time.
3. Methane in the global atmosphere degrades to CO2 over time.
All future CO2 contraction-budgets (whatever the rate) raise concentration in the atmosphere and the oceans.
The faster/lighter/sooner the budget, the less this happens. The slower/heavier/later the budget, the more this happens.
CLICK on the image below
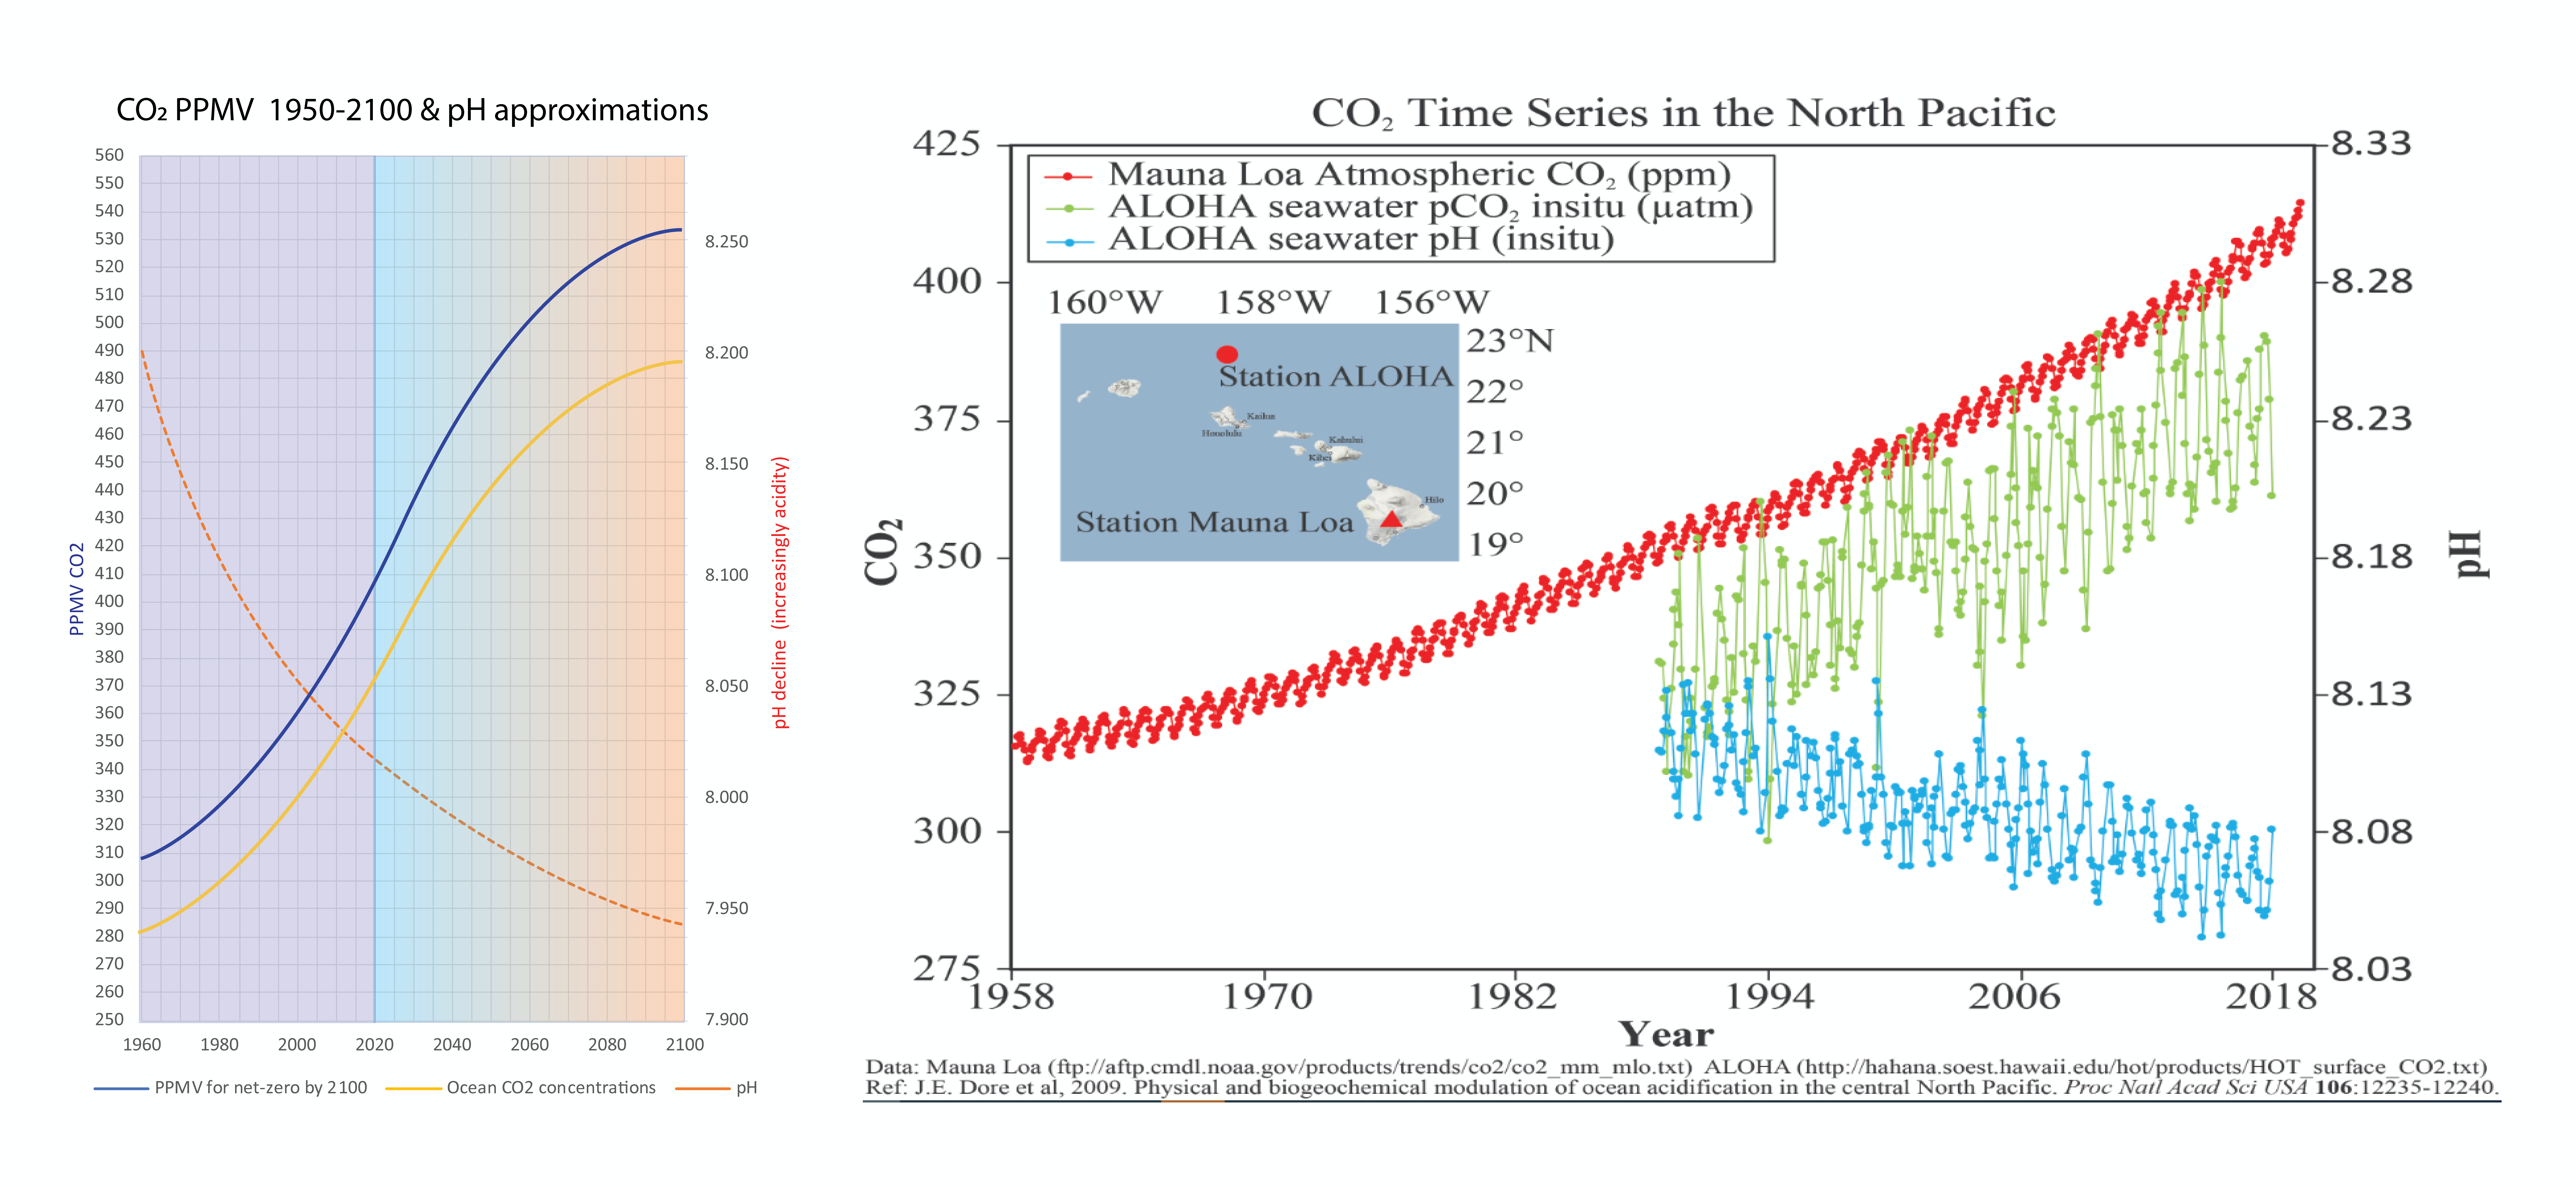
Doing this will animate the chart so the simple but deadly arithmetic of atmospheric CO2 and oceanic sink accumulation is revealed.

Oceanic CO2 concentration build-up with pH falling (increasing acidity).
