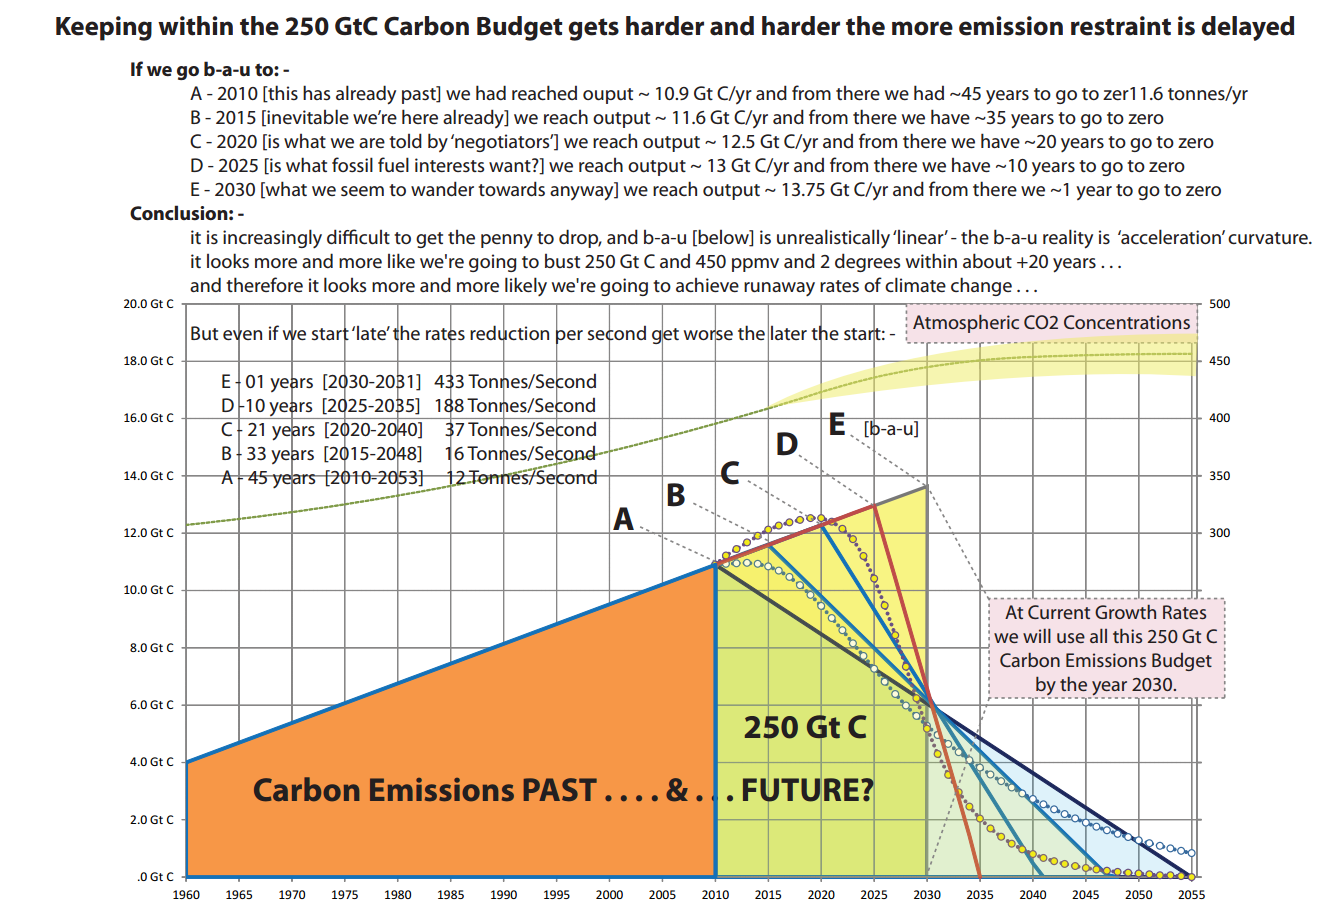
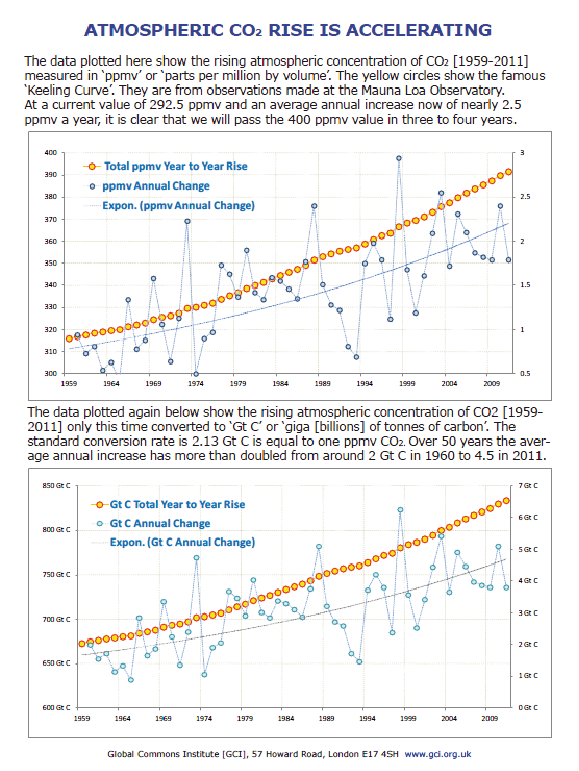
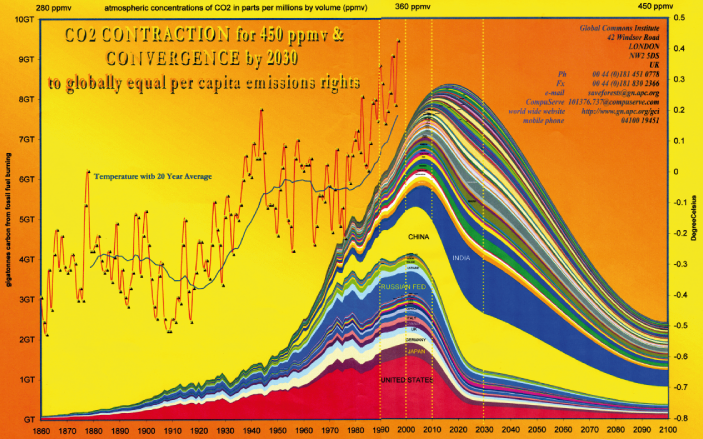
Using the 'pan and zoom' function in Acrobat 'tools' when viewing these
images makes it possible to see the detail and the 'big picture' together.
Click image to Download Detailed and 'Zoomable' pdf file
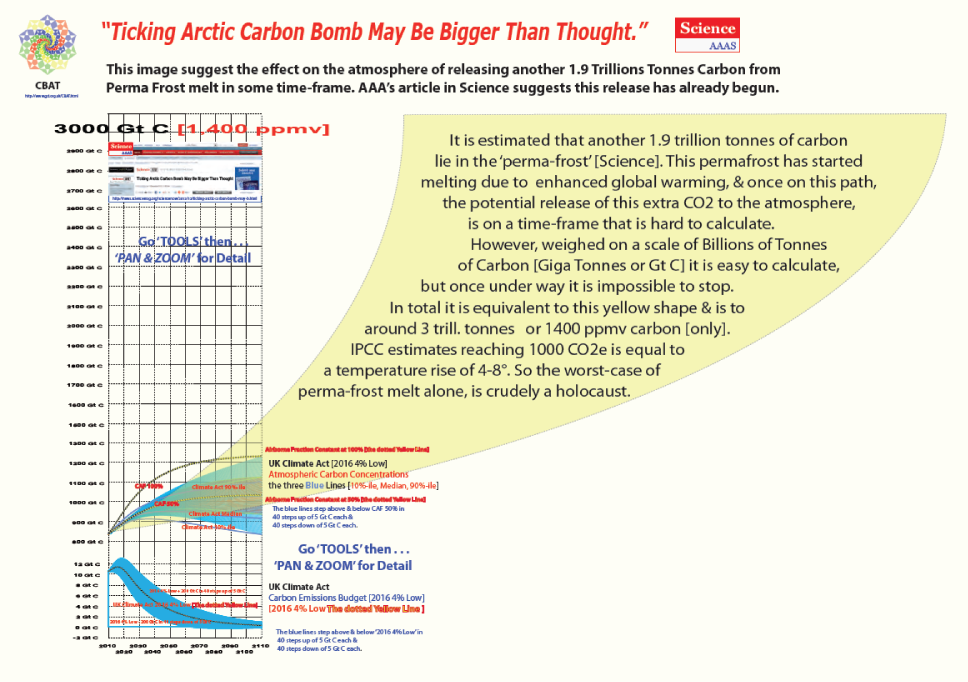
Extra 1.9 Trillion Tonnes Carbon from melting Perma Frost, as reported in Science [AAAS].
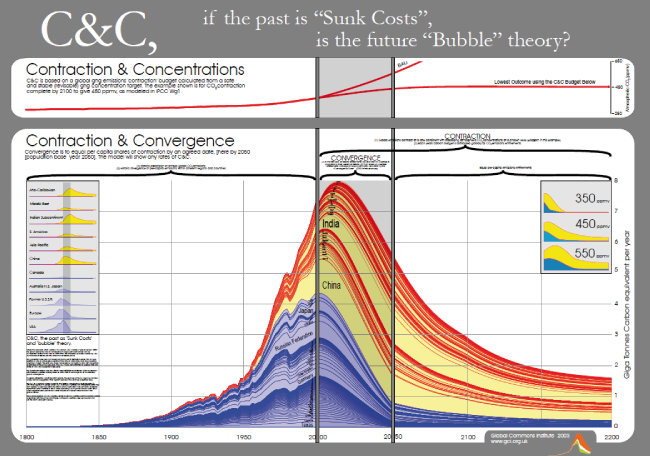
Large 'zoomable' all-country C&C graphic
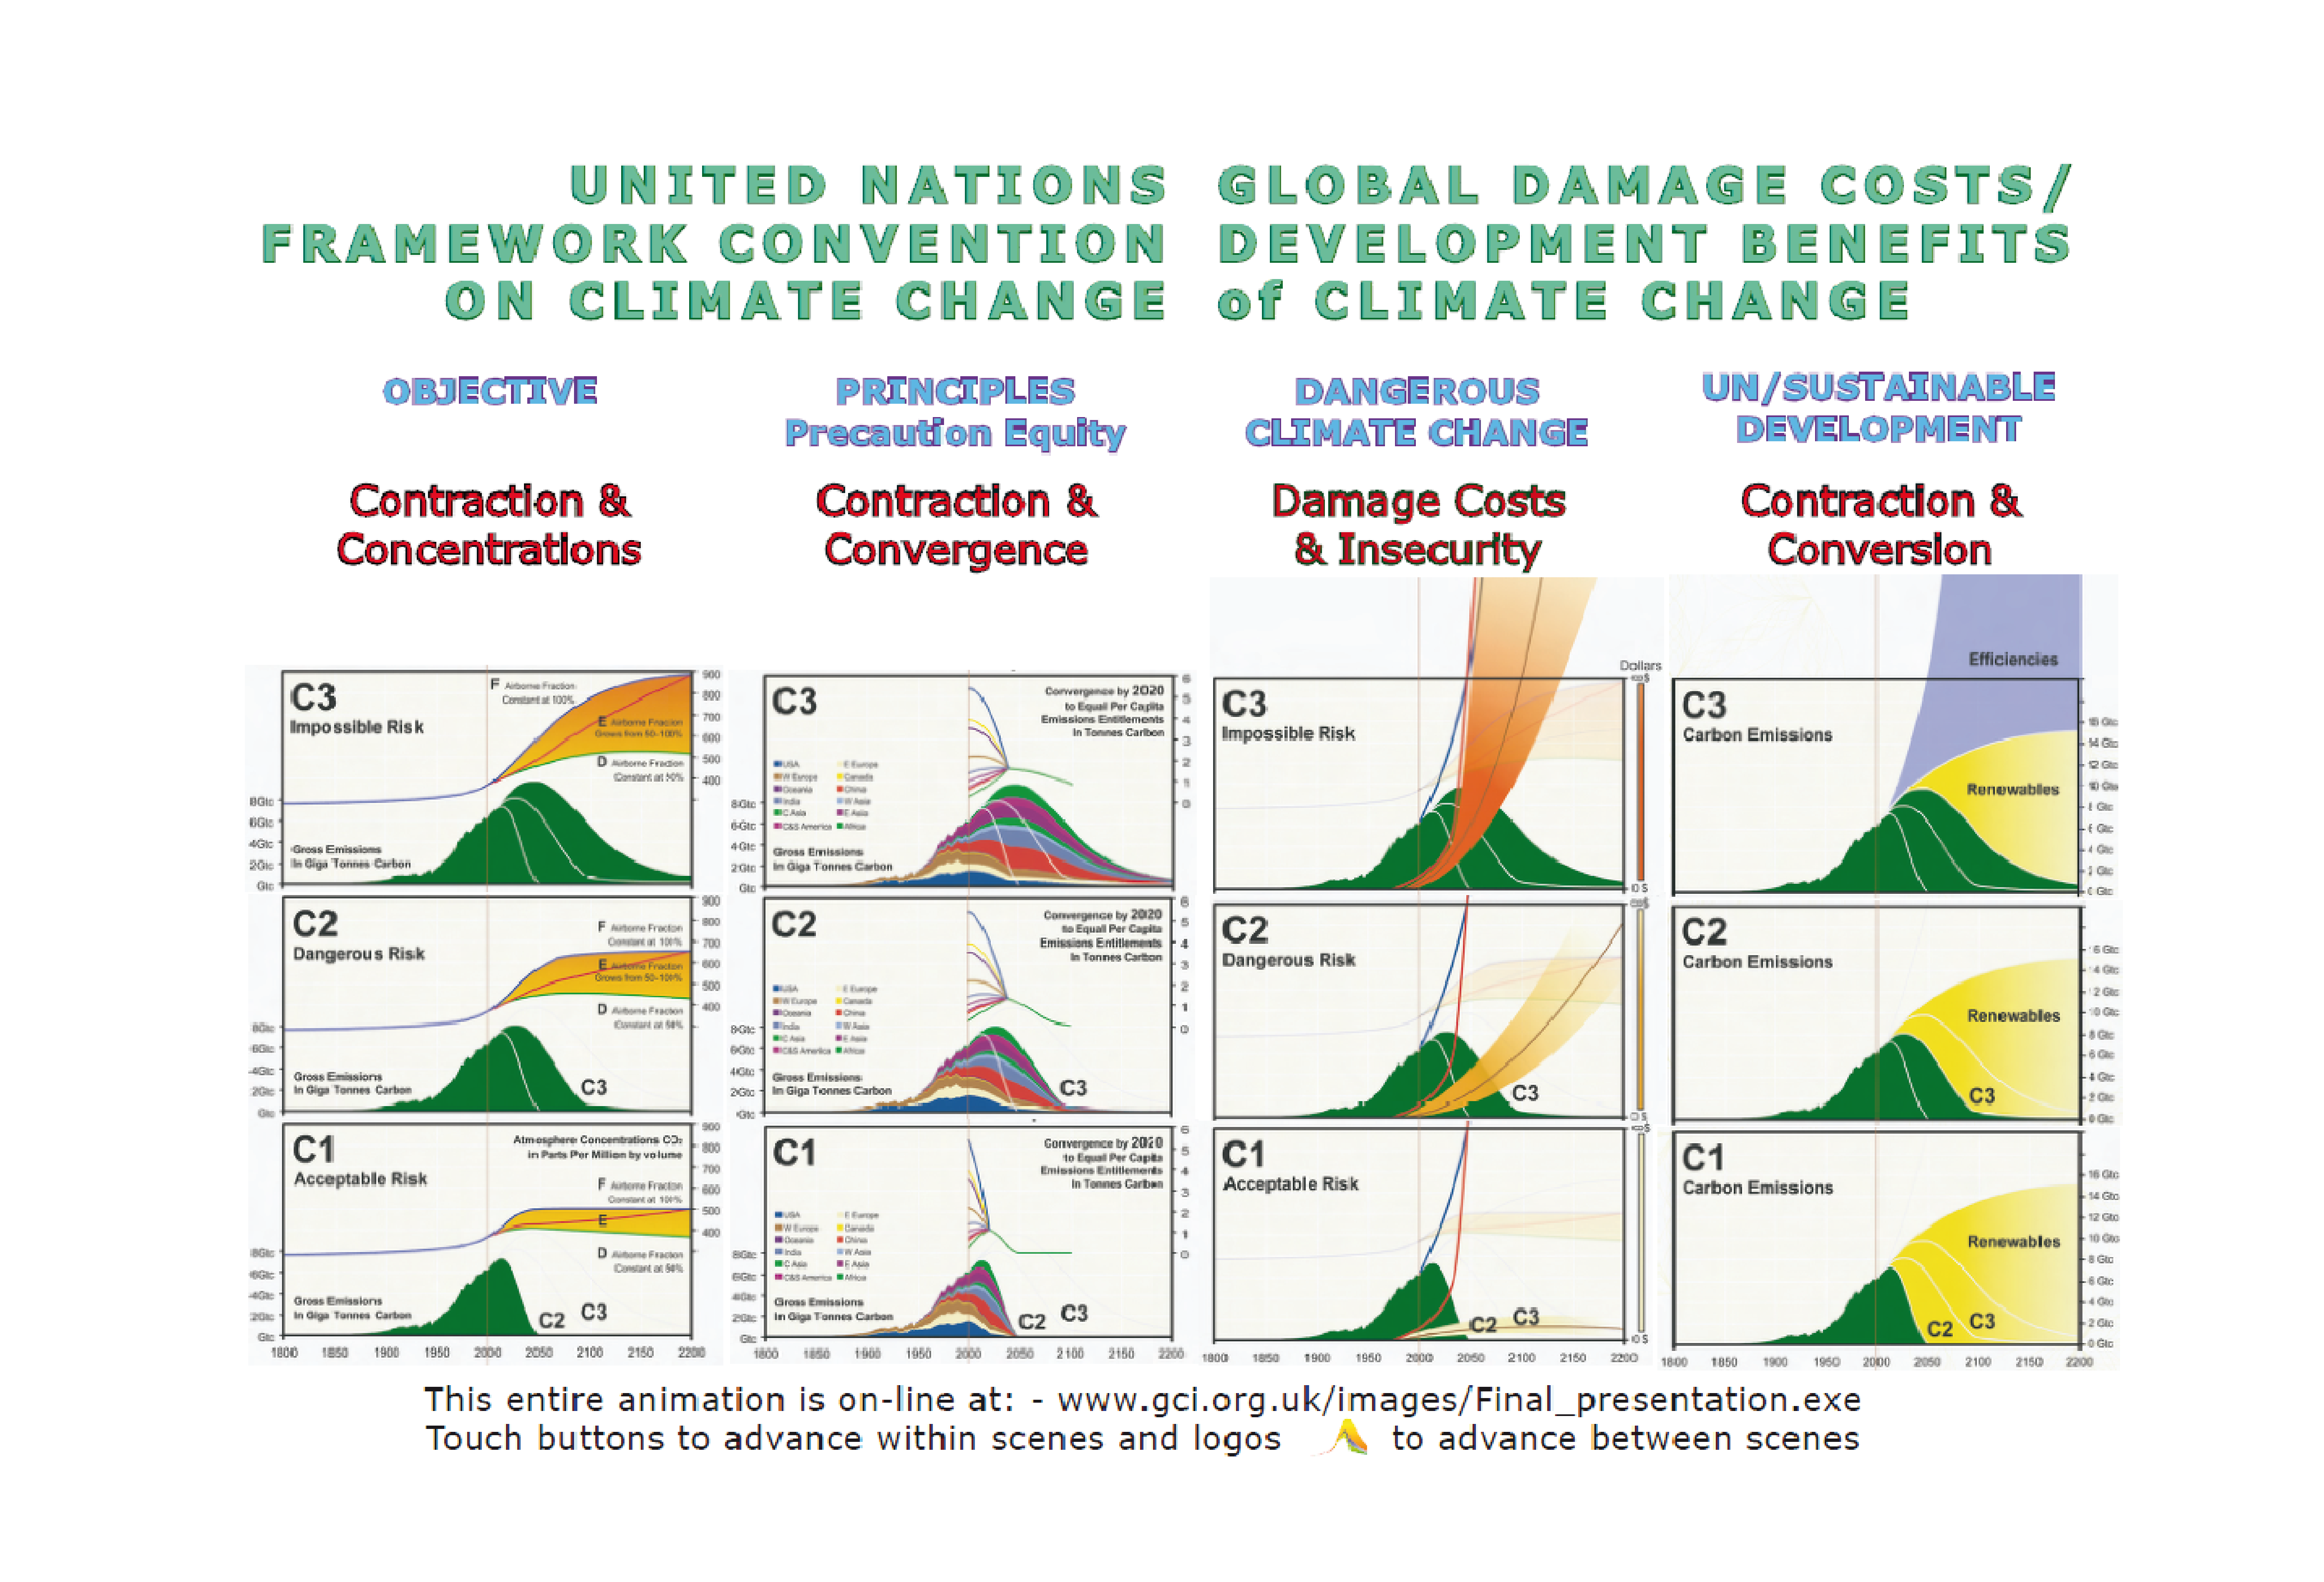
Acceptable [C1] Dangerous [C2] Impossible [C3]
Risk overview
Use 'pan and zoom' in Acrobat Reader to get 'big-picture' and 'smallest-detail' together.
Contraction-and-Concentrations with Contraction-and-Convergence.
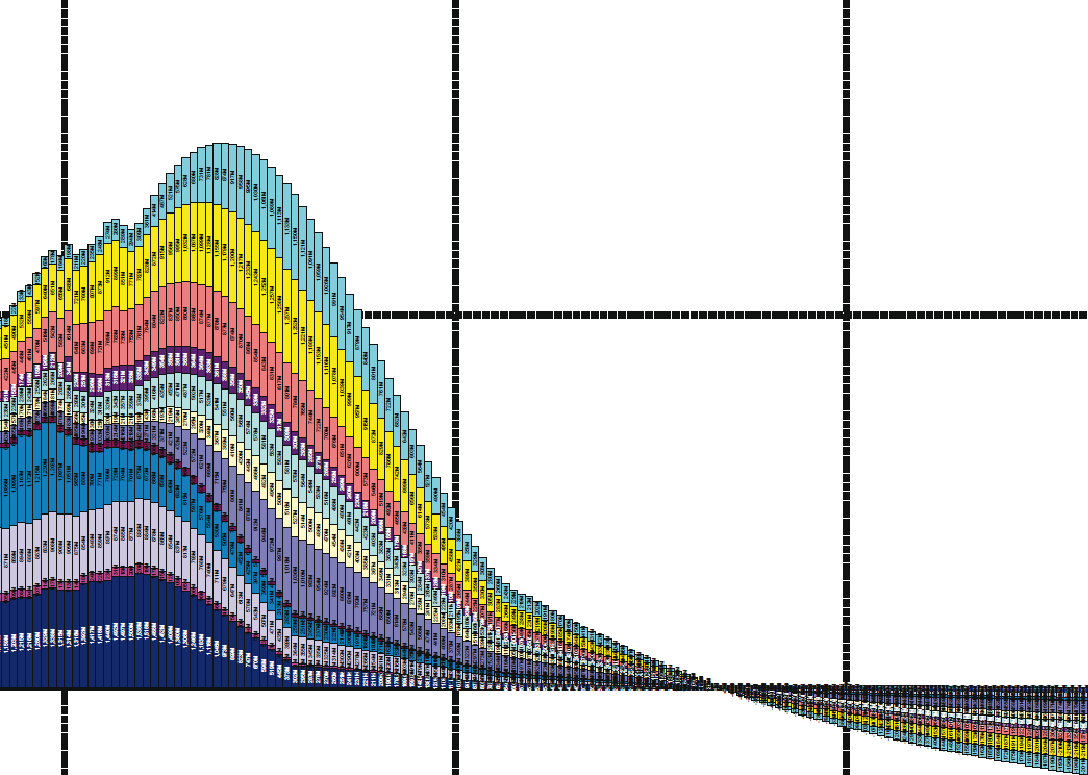
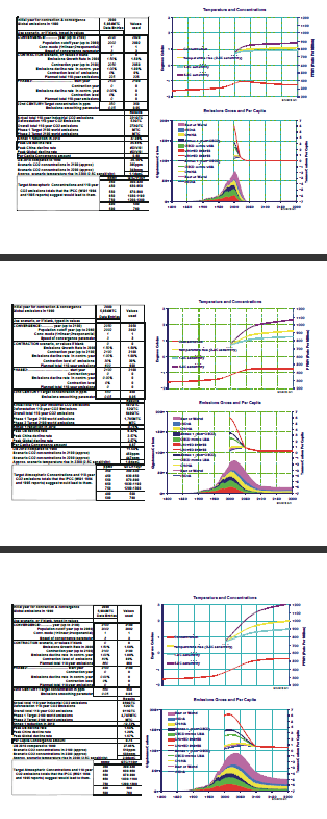
Deeply Zoomable C&C examples
with all detailed numbers
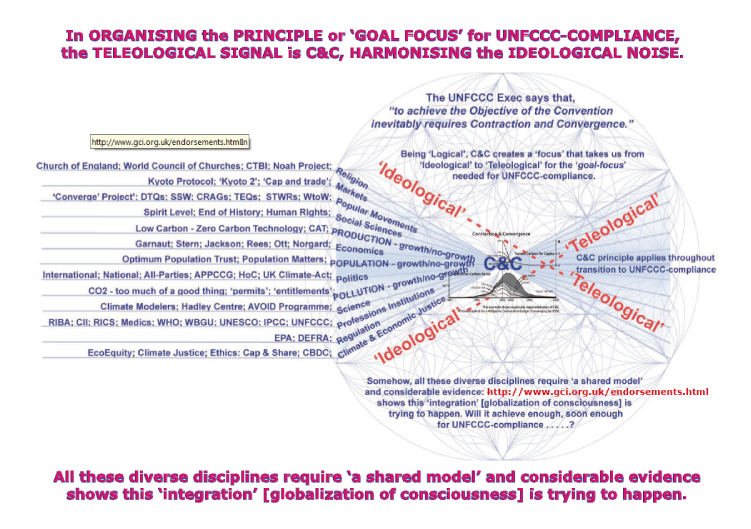
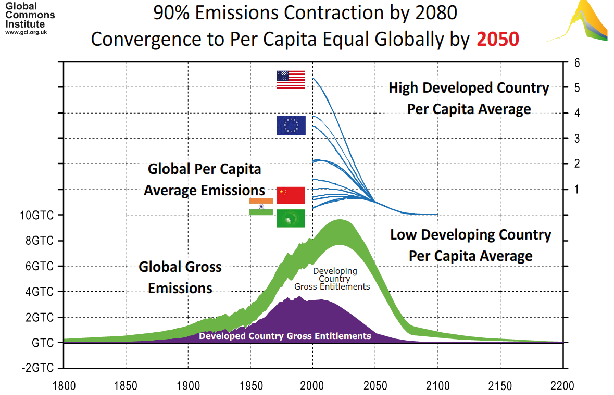
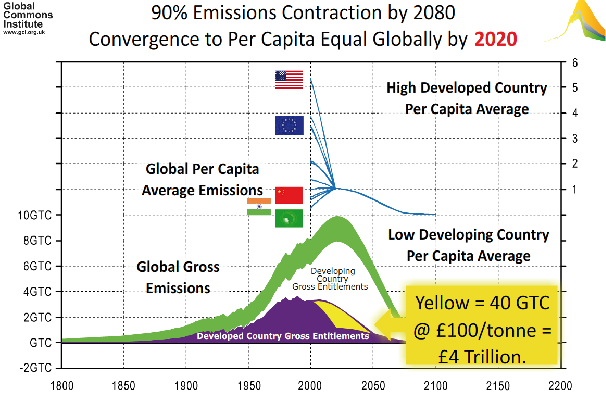
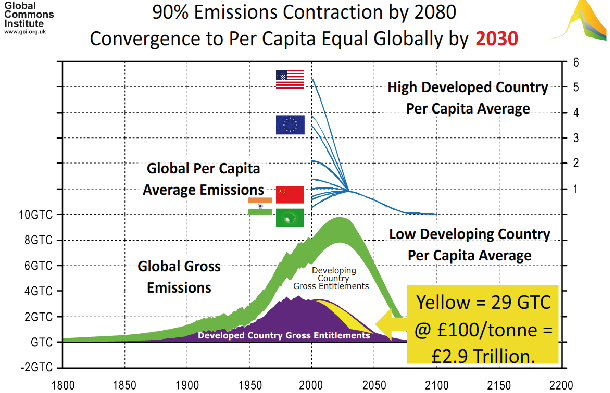
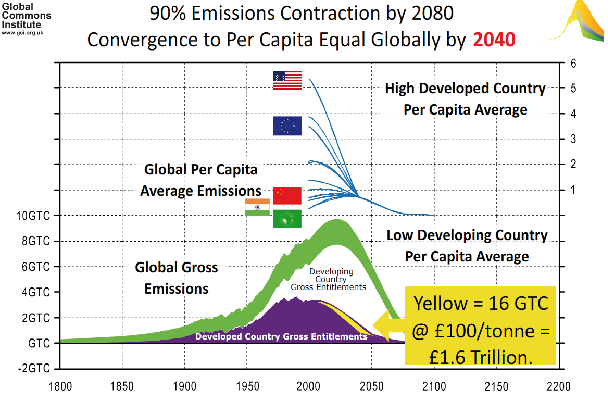
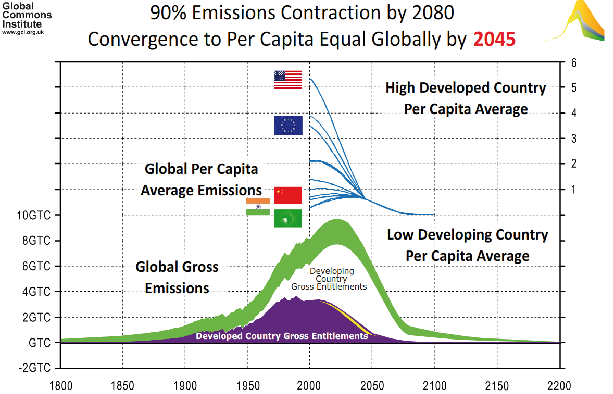
From Ideology to Teleology for UNFCCC-complianceThe image on the left shows immediate convergence - Chinese Government position at COP-15.
The image on the right shows convergence by 2050 - UK et al position at COP-15.
Negotiating the rate of convergence was entirely possible as this animation shows: -This is still the challenge Parties to the UNFCCC face at COP-17 in Durban this year.
~~~~~~~~~~~~~~~~~~~~~~~~~~~~~~~~~~~~~~
With reference to the failure that actually occurred at COP-15, the C&C mechanism demonstrated here [3,300 downloads last month alone] also compares C&C with 'alternatives' such as GDRs [see below].
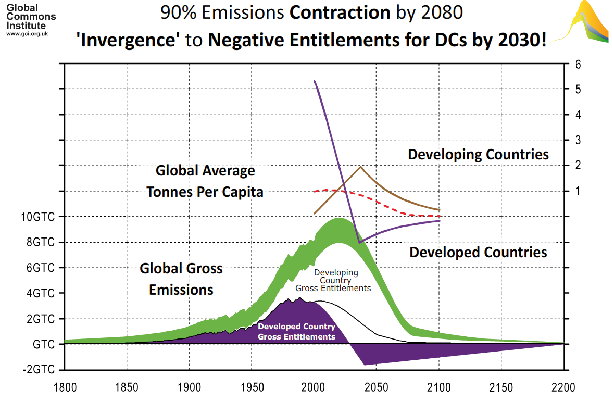
The GDR Report, The Right to Development in a Climate Constrained World: The Greenhouse Development Rights Framework, Revised Second edition (Berlin: Heinrich Boll Foundation 2009) and quoted in the OXFAM report referred to below, openly states the following: -
"The national mitigation obligations of the high-RCI countries of the North vastly exceed the reductions they could conceivably make at home. In fact, by 2030, their mitigation obligations will typically come to exceed even their total domestic emissions!
Which is to say that wealthier and higher-emitting countries would be given *negative allocations* as is necessary in order to open enough atmospheric space for the developing world.
[Editor - this is random; does it mean *120%* emissions cuts in the US by 2030 - or greater?].
Fuller exposition here - this kind of argument is seen as 'the other side of a firewall' by the US Government i.e. being on another planet or making the UNFCCC into a 'Versailles Climate Treaty'.~~~~~~~~~~~~~~~~~~~~~~~~~~~~~~~~~~~~~~
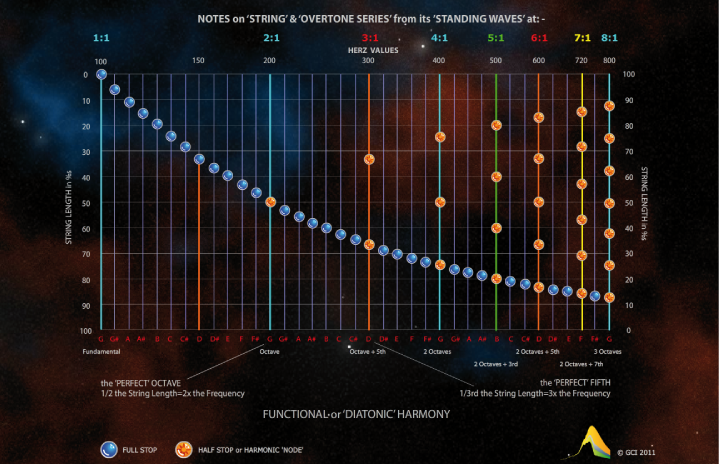
Pythagorean 'String Lengths' - Diatonic Harmony
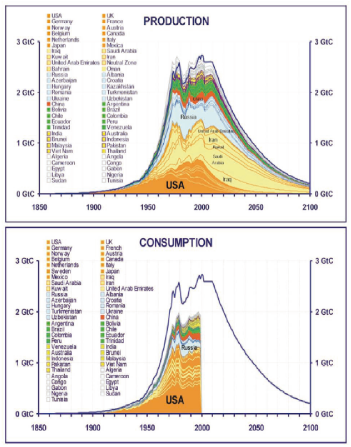
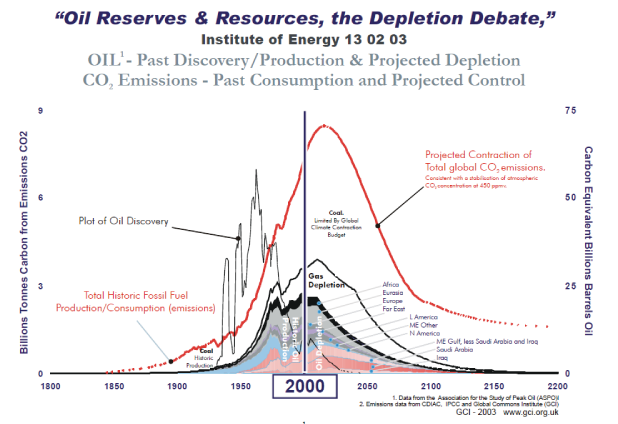
Global Oil Conusmption_Production_Depletion
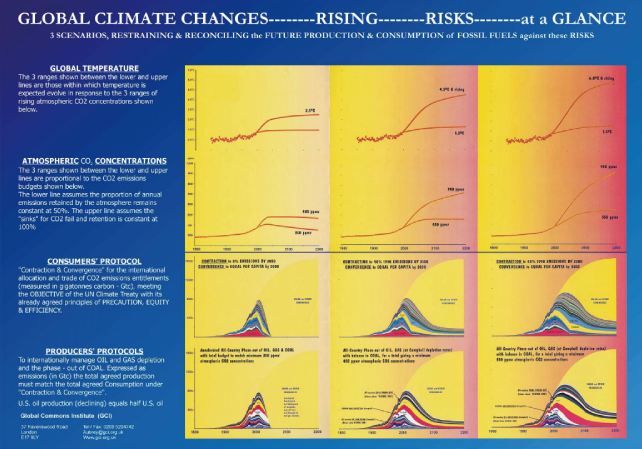
Poster Oil Coal Gas & 350 450 550 ppmv
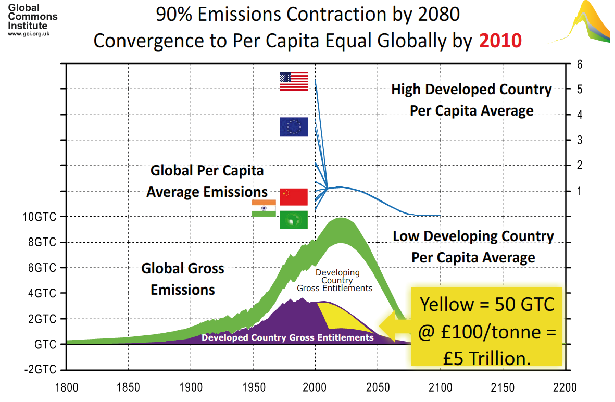
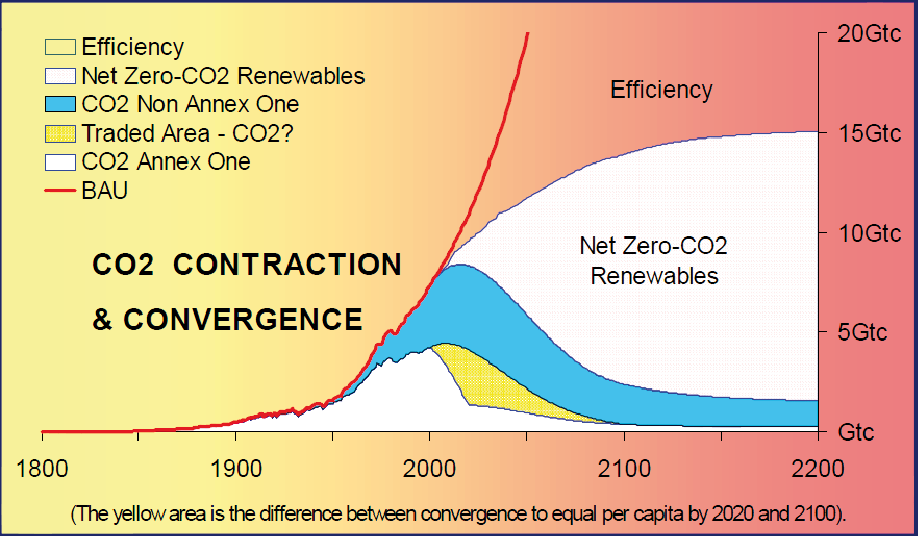
Traded Area Under a C&C Scenario
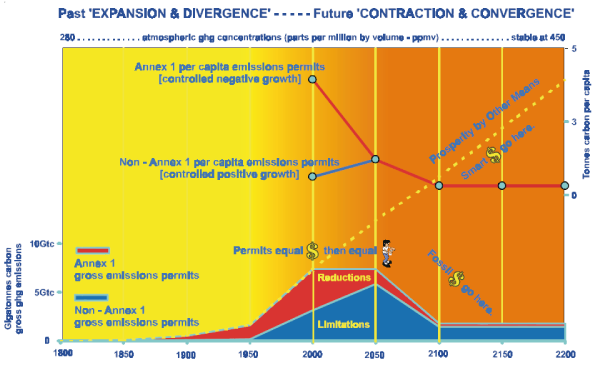
In a global C&C-framework-based-market, this is an example of the difference between per capita emissions and per capita entitlements to emit.
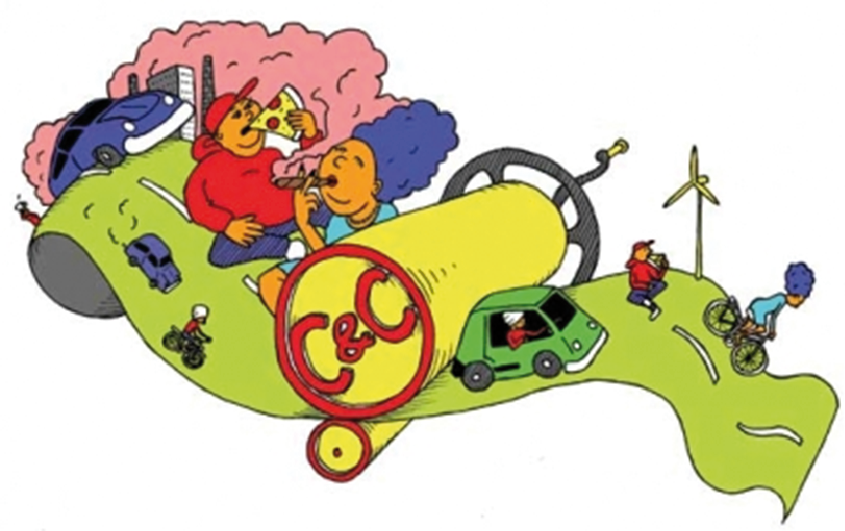
Sly take on C&C from creative Swedish source
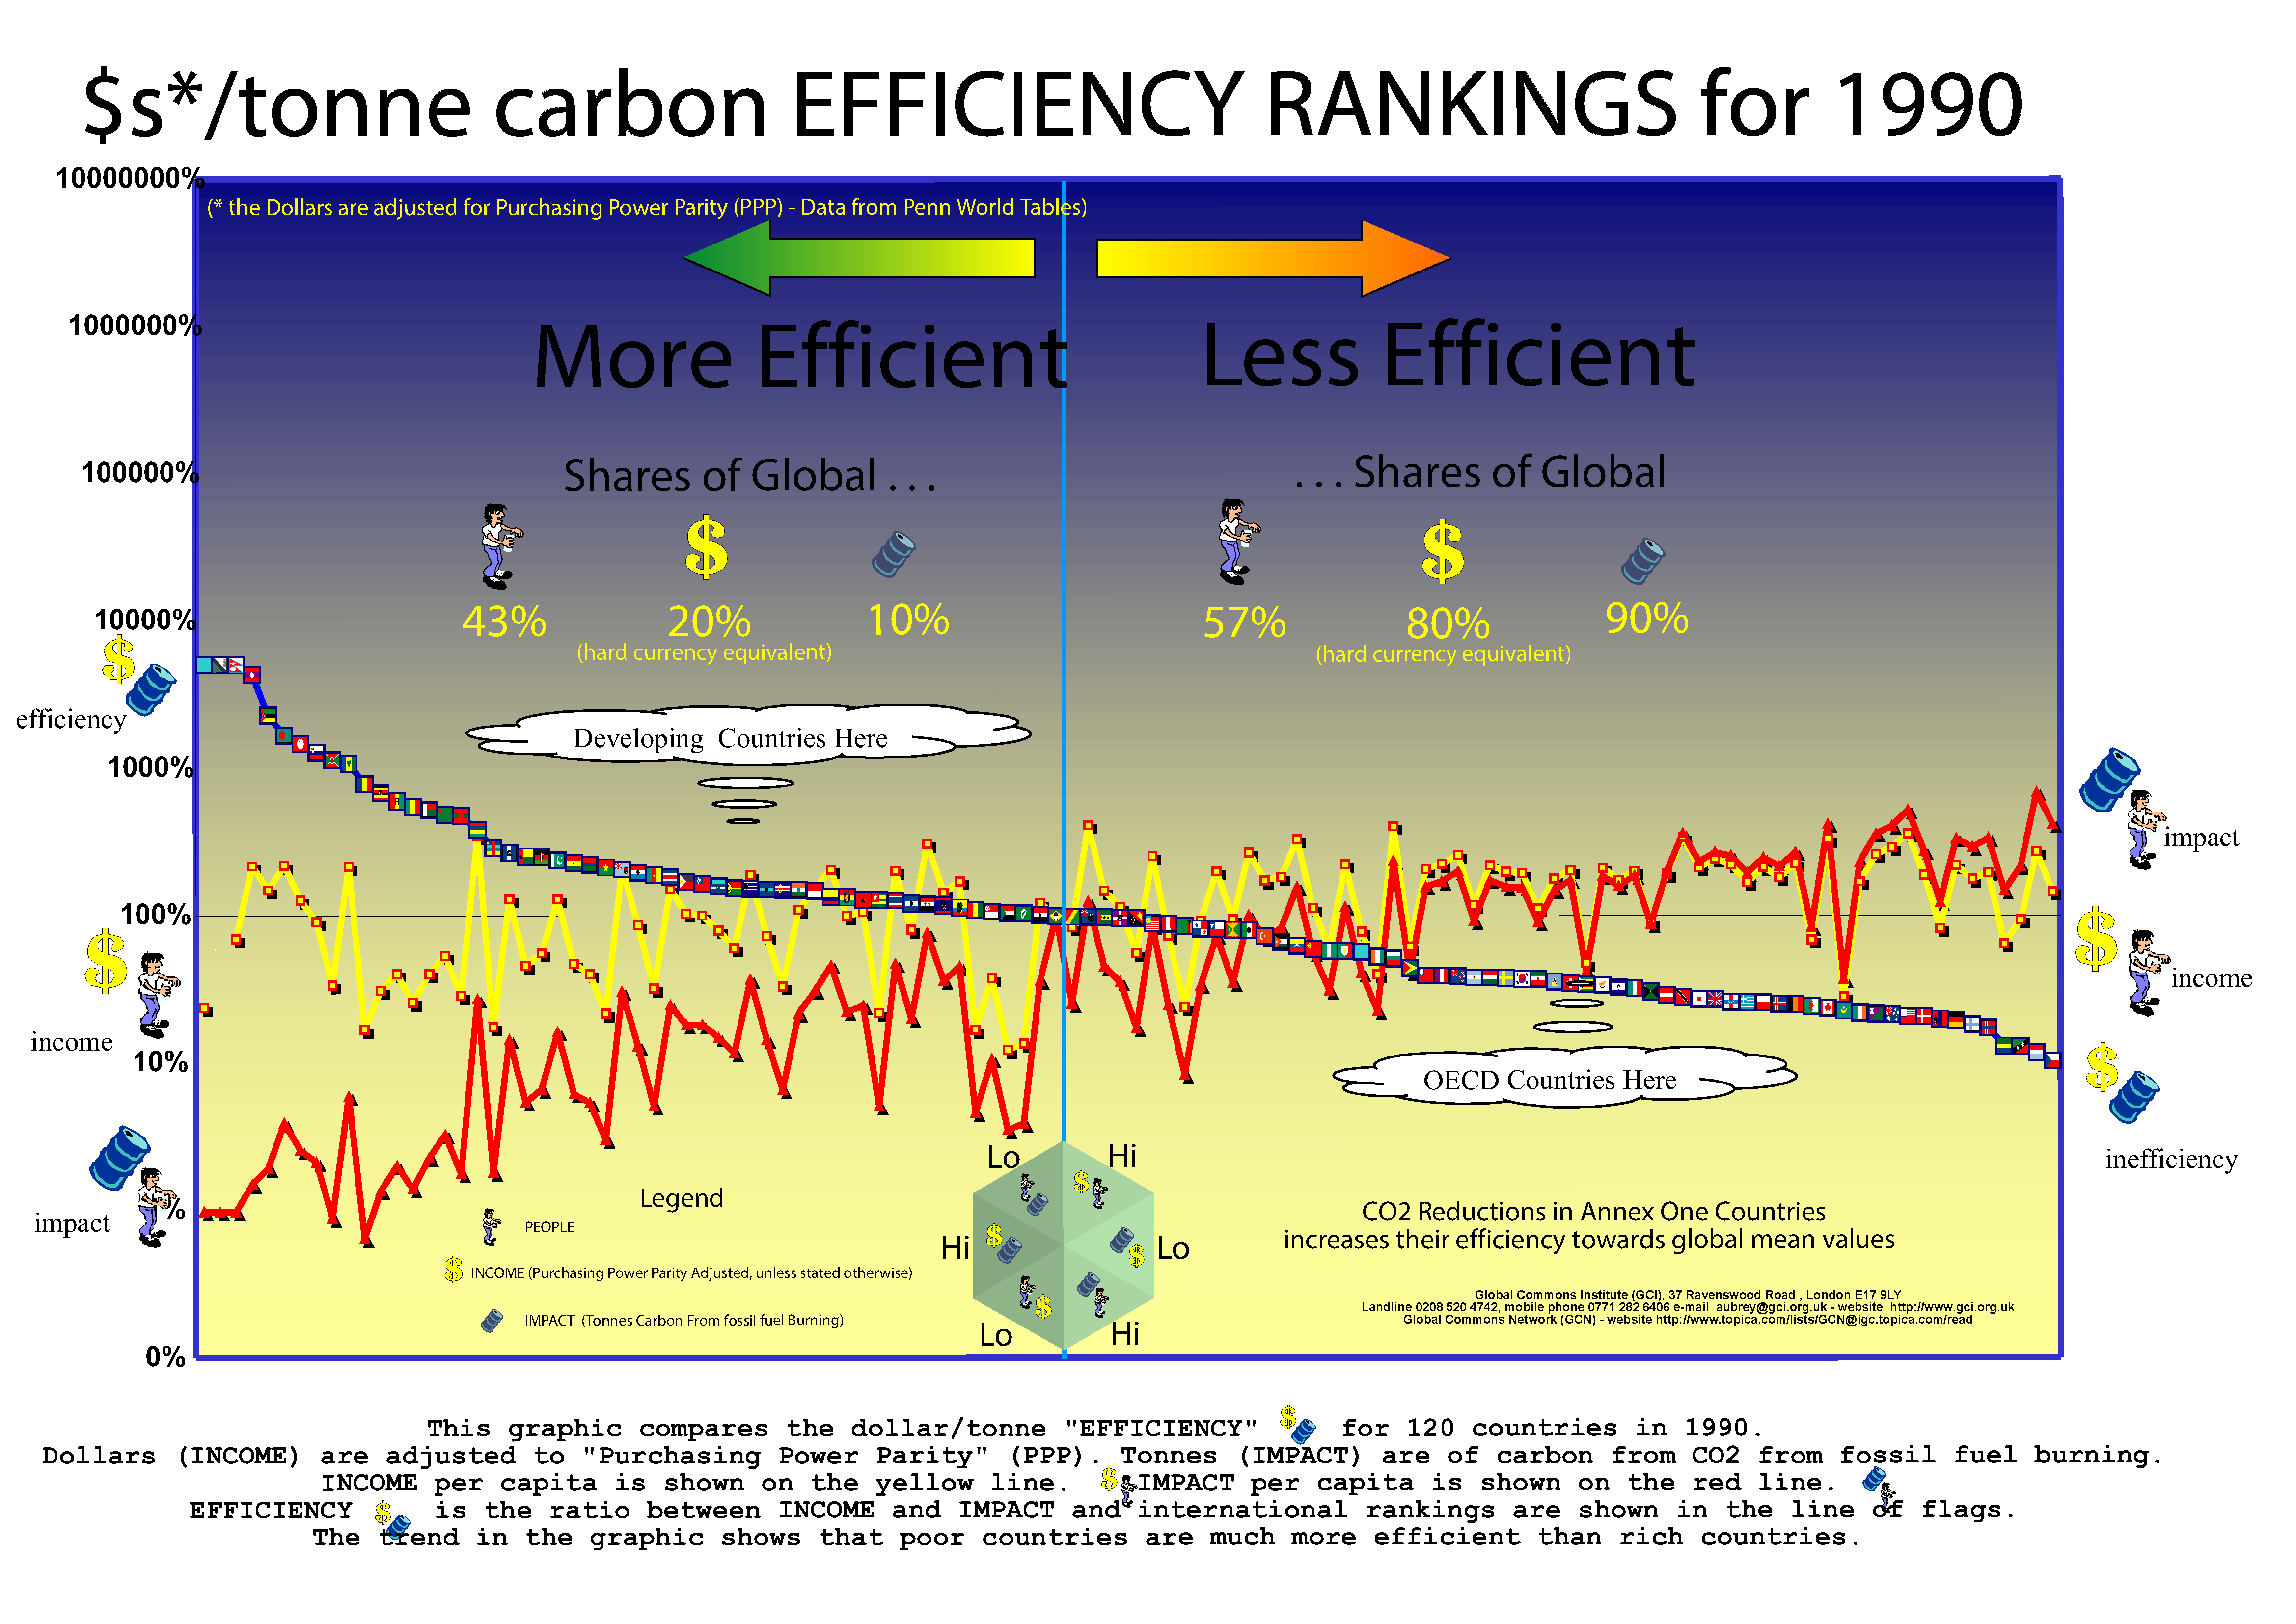
This graphic compares the dollar per tonne "EFFICIENCY" for 120 countries in 1990.
Dollars are adjusted to "Purchasing Power Parity" (PPP).
INCOME per capita is shown on the yellow line.
IMPACT, ortonnes of carbon per capita from CO2 from fossil fuel burning, is shown on the red line.
EFFICIENCY is the ratio between INCOME and IMPACT.
The international 'efficiency' rankings from high to low efficiency are shown left to right
in the line of flags that are easily viewable using 'pan and zoom' in Acrobat tools.
The trend in the graphic shows that on this measure of 'Climate-Economic-Efficiency',
poor countries are much more 'efficient' than rich countries.
GCI Briefing on C&C and the Byrd Hagel Resolution
In June 1997, the US Senate passed by 95 votes to 0 the Byrd Hagel Resolution, which stated that: -The US should not be a signatory to any protocol to, or other agreement regarding, the UNFCCC of 1992, at negotiations in December 1997, or thereafter, which would mandate new commitments to limit or reduce greenhouse gas emissions for the Annex I [developed country] Parties, unless the protocol or other agreement also mandates new specific scheduled commitments to limit or reduce greenhouse gas emissions for Developing Country Parties within the same compliance period.
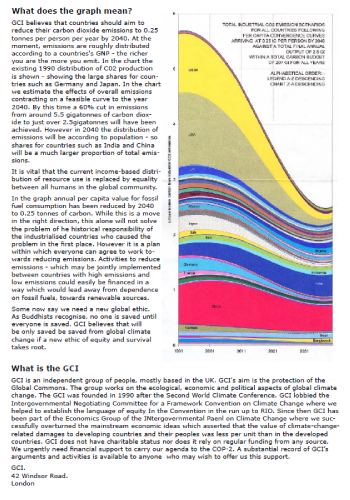
C&C is completely consistent with this Senate Resolution, as shown in this image. There is no other first-order way to calculate what the Resolution calls for, except universally uniform limitations or reductions, which is what the whole row had been about. For this reason, GCI offered support to the US and they accepted it.
Later poster of C&C used after COP-2
This got taken up and used all over the world. Comments like an Australian who said at COP-4, that says it all, or sitting in the US State Department with Climate Policy Guru Raef Pomerance before COP-3 in Kyoto in 1997, that is the best damn f******* graphic of what to about climate change I have ever seen.
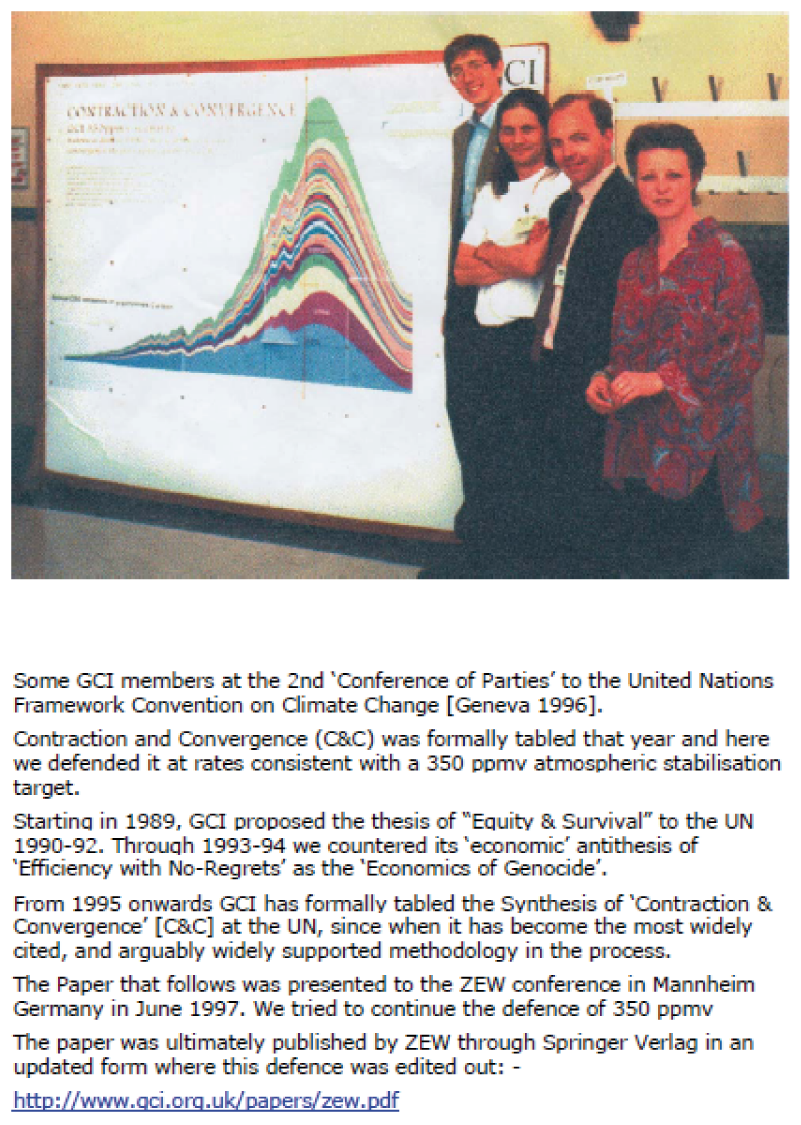
Some GCI members at the 2nd Conference of Parties [COP] to the United Nations Framework Convention on Climate Change [UNFCCC] in Geneva 1996. Contraction and Convergence (C&C) was formally tabled at that event that year. As shown in this picture, we defended it at rates consistent with a 350 ppmv atmospheric stabilisation target. Greenpeace, who also called for that ppmv value inexplicably led an NGO campaign against C&C. One could also ask where was Jim Hansen, now of 350 ppmv, at this time and indeed for the next ten years?Starting in 1989, GCI proposed the thesis of Equity & Survival to the UN 1990-92. Through 1993-94 we countered its economic antithesis of Efficiency with No-Regrets as the Economics of Genocide. From 1995 onwards GCI has formally tabled the Synthesis of Contraction & Convergence [C&C] at the UN, since when it has become the most widely cited, and arguably widely supported methodology in the process. The Paper here was presented to the ZEW conference in Mannheim Germany in June 1997. We tried to continue the defence of 350 ppmv. When finally published by ZEW through Springer Verlag in an updated form, this 350 defence was edited out.
GCI C&C Paper for ZEW 1996 Conference Mannheim after COP-2, UNFCCC Bonn June 1996.
For the original GCI paper see here
For the version eventually published see here
From the world's premeire forensic throbgoblin Marc Roberts
UNFCCC C&C Submission - Support for Submission - CBAT - Responses to CBAT

